Price action trends is a trading concept that embodies analysis of current trends to forecast future values. In order to trade successfully in Forex you should commit to memory that the trend is your friend. These trends allow you to identify the trajectory of price movements through which you can ride the wave of rising or falling prices and gain from the trade.
In this lesson we will guide you on how to trade gold in the Forex market using the most effective yet extremely simple strategy of utilizing price action trends.So are you ready to learn about the winning combination of trading gold in the Forex market? First lets take a look at a little introduction to Price Action Trends along with some supporting charts. Good, Lets’ begin!
Price Action Trends: Introduction
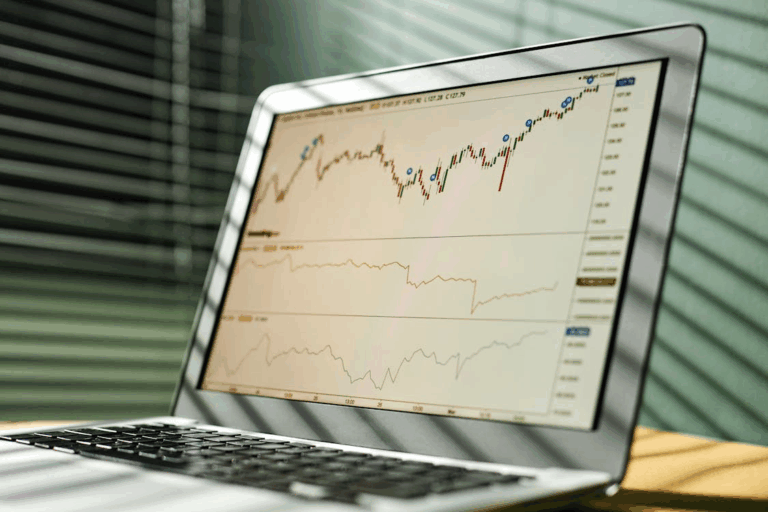
Using price action trend to trade in gold is not that difficult at all. In fact, it is much easier than using complex technical indicators to forecast future values. All you need is a simple candlestick chart that is cleared of all the technical indicators to predict trend of gold prices. You may have heard of the idiom to never judge a book by its cover. You have to venture inside to find the real worth of the book. This is especially true with price action charts.
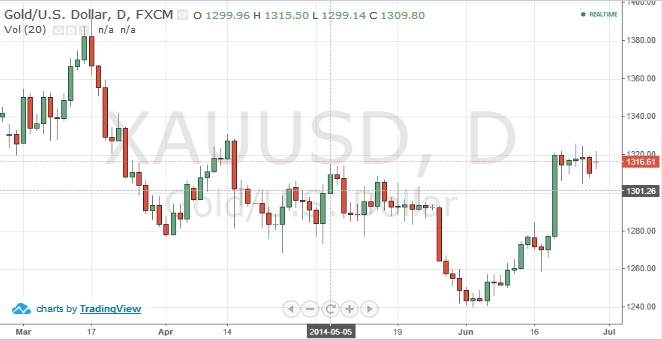
At first glance, the gold price chart above may not indicate anything. This same gold price chart holds the key to determine future trend of the gold prices. If you think you need detective skills of Dick Tracey or Miss Marple to unearth a clue about gold price trends, then you are wrong. In order to read this chart successfully, you only need to know the chart patterns that determine gold price movement in a particular direction.
Identifying Price Trends Through Chart Patterns
 Most beginner traders believe that the prices continue to move in a specific direction with a zig zag motion. They think that successful forex trading involves making a “guess” as to which direction the price will move, either upwards or downwards, as it continues to move in a specific direction. However, this concept is not correct.
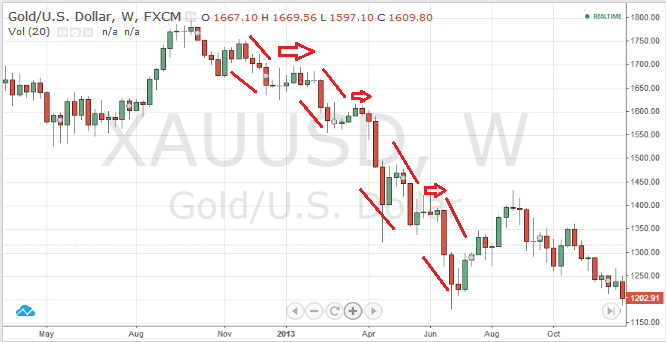
The reality is that the price alternates with a period of consolidation (counter-trend) as it is trending in a specific direction. The best way to make money in Forex is to wait for the period of consolidation and profit from the trade.
Price Consolidation Levels
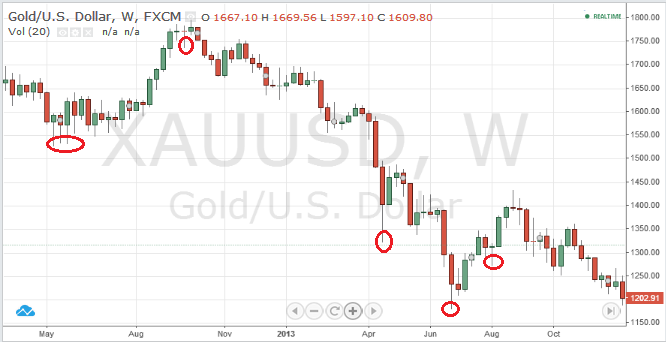 In order to gain profit from the counter trend or consolidation of gold prices, you have to know the price levels where counter trend is predicted to occur. Normally counter trends occur when there is a big gap between opening and closing prices. In the candlestick chart, you can identify this level when the lower wick of the candle is longer than usual. Traders can gain from the trade when they make an entry at this level and then quickly exit as the price rises or falls counter to the trend.
Trending Prices
Besides knowing how to determine consolidation trends from price charts, you should also know how to read trending prices of gold using these charts.
Basically higher highs (HH) and higher lows (HL) determine upward trend of the prices, while lower highs (LH) and lower lows (LL) determine downward trend of gold prices. You can see from the gold price chart above that when the gold prices are trending downwards, the chart shows HH and HL trend. On the other hand when the gold prices are trending upwards the chart shows LH and LL trend.

In conclusion, price charts are a simple and effective tool to determine gold price trends. These prices are the leading indicators of price movements that can help traders determine the correct entry and exit timing and raise the chances of obtaining profits from the Forex trade.