Peter Tudor Jones, CEO of Tudor Jones Capital, attributed his success to The Elliot Wave approach. The Elliot wave was formulated by an American accountant Ralph N. Elliot in the late 1920s. The theory is based on the principle that worldly events occur in a 5-wave pattern. The same principle can also be applied to the financial markets.
In the context of a financial market, Elliot wave theory specifies that the market advances in the form of a five-wave pattern. There would be three up waves that are separated by two down waves. The three up waves are numbered 1, 3, and 5, while the down waves are numbered 2 and 4.
The theory further assumes that in each five wave up-moves will be proceeded by five wave down-moves. This down-move consists of three down waves numbered 1,3, and 5 separated with two up waves that are numbered as 2 and 4.
Moreover, the Elliot wave theory also assumes that each of the two up and down waves (counter trend waves) numbered 2 and 4 will unfold in an ABC pattern. What it means is that during the five ways up trend when the counter trend moves downwards, the currency pair will retrace part of wave 1 and advance in a pattern consisting of two smaller down waves separated by one up wave. The down waves are labeled as A and C while the up wave is labeled as B.
Similarly, during five ways downtrend, the currency pair will retrace part of wave 1 and decline in a pattern consisting of two smaller up waves labeled as A and C separated by a small down wave labeled as B.
Using Elliot Wave Strategy in Trading Gold in the Forex Market?
Application of Elliot Wave

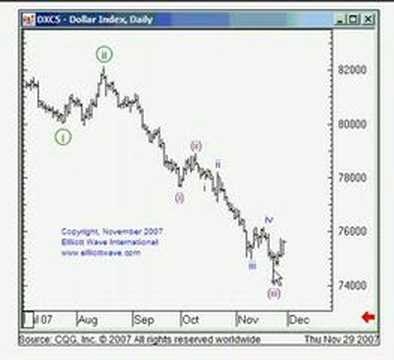
The above figure is a setup of a short trade. You can view that a particular trading day, the red number 4 appears above the price bar. The green number 3 appears below the price bar that continued for several days. Below this chart, you can view the 3 day RSI is ticked lower on the day and that the 90 day CCI is negative.
This confirms the setup and indicates a sell short signal. We can calculate the stop-loss price by adding the currents day’s high price to three times the average true range over the last three days over the last three days.
Set-Up of Elliot Wave Pattern
You need to perform the following steps to apply Elliot wave pattern as part of your gold trading forex strategy.
Step 1: Generate a Elliot Wave Pattern on an Advanced Gold Charting Tool- You can use the Advanced Gold Chart Tool on TradeGoldOnline.
Step 2: Look for the Wave 5 Set Up- Watch for a wave marked as 3 to change to a wave marked as 4. It is after this point that wave 5 is expected to occur. You should remember that this step is time consuming and it could occur only a few times of the year.
Step 3: Confirm the Trend Using RSI or CCI indicator- Once the wave 3 changes to wave 4, you should use the RSI or CCI indicator to confirm the position. When the 90-day CCI is positive and the RSI index reverses to upside for a day, it confirms that we should enter a long position. Similarly when 90- day CCI is negative and the 3 day RSI reverses to downside for one day, we should enter a short position.
Step 4: Calculate a Stop Loss Point- You should make an exit in the following conditions.
1. If the 3-day RSI reaches 15 or lower for a short trade, or 15 or lower for a short trade, or reaches 85 or higher for a long trade.
2. If the wave count changes from 4 to 5, we should sell only half of our trade and adjust trailing using the following formula:
a. For long trade, subtract one time the three day ATR (average true range) from previous day’s range.
b. For short trade, add one time the three day ATR (average true range) from previous day’s high.
You enter the trade at the next day’s open price at which stop-loss order would also be placed. Remember that it is a trailing stop and it would be updated at the opening of the next trading session.
Example of Elliot Wave Setup

In the figure above you can view that after about a month, the 3-day RSI gave a reading below 15. At this point we should buy back half of our trade. In addition, we need to adjust the trailing stop by adding current day’s high to one time rather than three times the average true range over the past three days. This will result in a more tighter trailing stop.
Summary
Elliot wave is a powerful technical indicator to place order in the online Forex market. For successful gold trading in the Forex market, you should practice interpreting the Elliot wave count. In addition, you should also practice how the stop loss point is calculated. Once you have become adept at interpreting the Elliot wave chart and placing stop loss order, you can then apply it to your gold trading forex strategy more successfully.

