
Gold Chart Support and Resistance Explained
Support and resistance are key technical analysis concepts that are commonly used in the analysis of financial markets, including the gold market. In this blog post, we will explain what support and resistance are and how they can be identified on a gold chart. We will also provide some examples of how to use support and resistance levels to make trading decisions.
What is support?
Support is a level on a chart where the price of an asset tends to find buying interest, meaning that the price tends to bounce off this level rather than break through it. This happens because buyers tend to step in at this level and absorb the selling pressure, causing the price to stabilize or even rise.
Support levels can be identified by looking for instances where the price has bounced off a particular level on the chart in the past. These levels can be horizontal (i.e. the same price level) or diagonal (i.e. a trendline).
Here is an example of a horizontal support level on a gold chart:
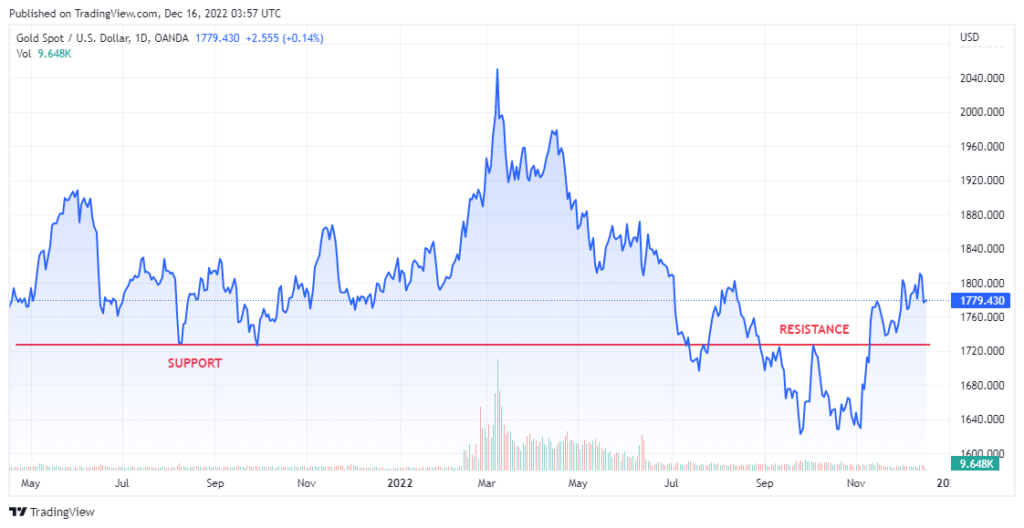
In this example, the price of gold finds buying interest at the $1,800 level, as it has bounced off this level multiple times in the past. This suggests that there is a significant amount of buying pressure at this level, which makes it a key support level.
What is resistance?
Resistance is the opposite of support and refers to a level on a chart where the price of an asset tends to find selling interest. This means that the price tends to hit a ceiling at this level and has difficulty breaking through it. This happens because sellers tend to step in at this level and absorb the buying pressure, causing the price to stabilize or even fall.
Like support levels, resistance levels can be identified by looking for instances where the price has hit a particular level on the chart in the past and then retreated. These levels can also be horizontal or diagonal.
Here is an example of a diagonal resistance level on a gold chart:
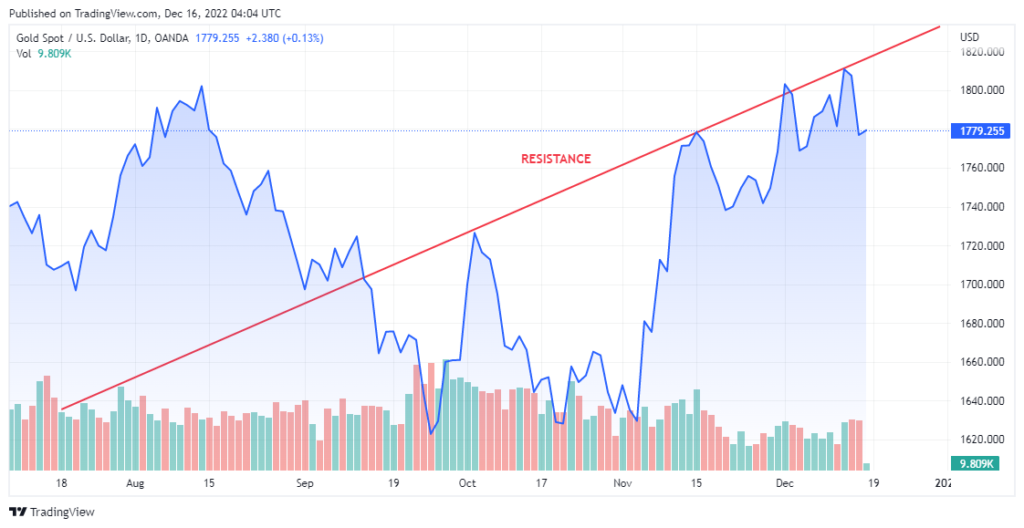
In this example, the price of gold hits a ceiling at the downtrend line and has difficulty breaking through it. This suggests that there is a significant amount of selling pressure at this level, which makes it a key resistance level.
Using support and resistance levels in trading
Support and resistance levels can be used to make trading decisions in a variety of ways. Here are a few examples:
- If the price of an asset is approaching a key support level, traders may look to buy the asset in the expectation that the price will bounce off the support level.
- If the price of an asset is approaching a key resistance level, traders may look to sell the asset in the expectation that the price will hit a ceiling at the resistance level.
- If the price of an asset breaks through a key support or resistance level, traders may look to enter a trade in the direction of the breakout, as it can signal a change in market sentiment.
- It is important to note that support and resistance levels are not absolute and can change over time. Traders should keep an eye on these levels and adjust their trading strategies accordingly.
In conclusion, support and resistance are key technical analysis concepts that are commonly used in the analysis of the gold market and other financial markets. By identifying these levels on a chart and using them to make trading decisions, traders can potentially capitalize on price movements and improve their chances of success.