Gold Trading Online in Forex Market Using Trading Indicators
Forex traders use trading indicators to determine effective trade entry and exit points. Gold trading online can also benefit from the use of technical gold trading indicators to trade profitably in Forex. Hundreds of trading indicators are available on various online trading platforms. However, traders new to the scene of gold trading online should master a few basic yet effective trading indicators first before trying out advanced trading indicators.
Basics of Trading Indicators
Trading indicators are graphical displays of information and historical data that traders can use to make decisions relating to Forex trades. Online trading platforms have various trading indicators that provide visual market feedback in the form of charts and graphs. Gold indicators for trading allow you to analyze historical prices and volume activity of a trading instrument. You can use this information to forecast future price trends and increase your chances of earning profit from the trade. You must note that technical indicators do not give you any signal to buy or sell a currency pair; you have to interpret the trading signals and analyze the best time to enter and exit a trade according to the risk appetite of the traders. Forex trading indicators comes in various forms. These trading indicators are used to interpret volatility, trend, momentum, and volume. Most of the trading indicators can be grouped into two types.
- Leading Indicators
- Lagging Indicators
Leading gold trading indicators are those that signal you when prices are trending either up or down. Contrarily, lagging indicators confirm that the price movement has entered a specific trend and is moving in a certain direction. These technical indicators can also be categorized into the following two types:
- Trending Indicators
- Oscillating Indicators
Trending indicators signal the trend of a specific currency pair. It signals direction of the currency price movements. Oscillating indicators, on the other hand, signal momentum of currency prices. It signals when the prices will continue in a specific direction and when they will lose momentum and reverse direction. Here we will discuss some of the most important trending and oscillating indicators that can facilitate gold trading online in the forex market.
Trending Indicators
Moving Averages
Moving averages are at type of trending indicators that determine direction of the currency pair price. These gold trading indicators also show you potential support and resistance levels so that you can determine effective entry, exit and stop loss points. The advantage of using moving average indicator is that they identify simple trends. Moreover, moving average indicators can be used for both short term and long term. 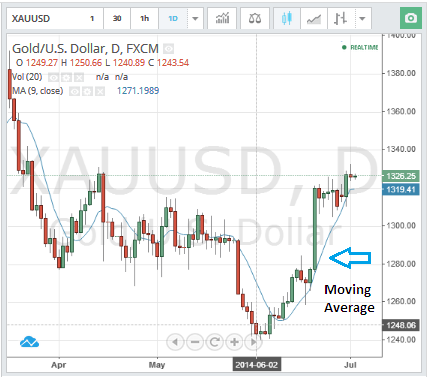 Entry Signal – Long Position: When an up trending currency pair bounces back up after hitting the up trending moving average. Short Position: When an down trending currency pair bounces back down after hitting the down trending moving average.
 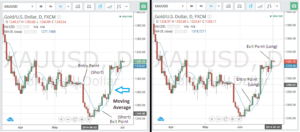 Exit Signal – Long Position: When the up trending currency pair again touches the up trending moving average you should exit the trade. You should set a stop loss at the point where the up trending prices touches below the up trending moving average. Short Position: When the down trending currency pair again touches the down trending moving average you should exit the trade. You should set a stop loss at the point where the down trending prices touches above the down trending moving average.
Bollinger Bands
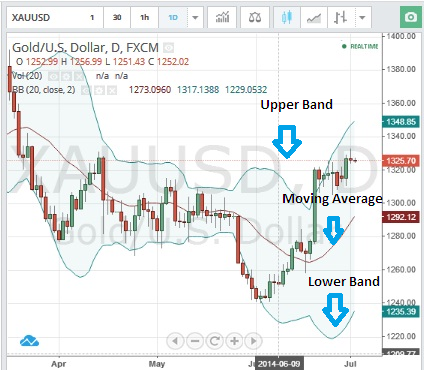
Bollinger bands are trending forex trading signals developed by John Bollinger. This trading indicator shows the trend and volatility of currency prices. It consists of two bands – an upper band and a lower band. Bollinger bands are plotted two standard deviations above and below the moving average line. The distance between the two bands represents the volatility of the prices. The bands will be wide when the prices are more volatile, they would be narrow when the prices are less volatile. 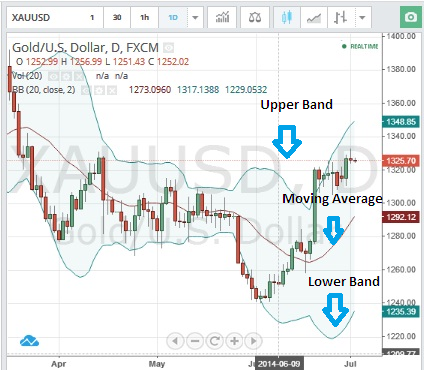 Entry Signal – You should make entry when the bands start to widen after a period of consolidation and the price start to move in the direction where they were moving prior to consolidation.
 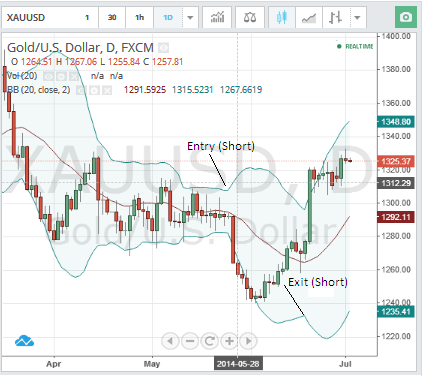 Exit Signal – You should make exit when the bands narrows and start to move towards each other. You should set a trailing stop loss to take you out of the trade when the trend reverses.
Oscillating Indicators
Commodity Channel Index
Commodity Channel Index was developed by Donald Lambert. This gold trading online indicator shows the strength of bearish or bullish trends along with volatility of these trends. It is usually plotted below the price action chart. CCI is based on the average value of the past price movements. CCI will be higher if the past prices have been trending higher and will be lower if the past prices have been trending lower. The CCI line oscillates back and forth crossing zero, 100, and -100 as it cycle through the progression.  Entry Signal – Long Position: You should make entry when the CCI passes above 100 and then turns back to cross 100 from above the line. Short Position: You should make entry when the CCI passes below -100 and then turns back to cross -100 from below the line.
 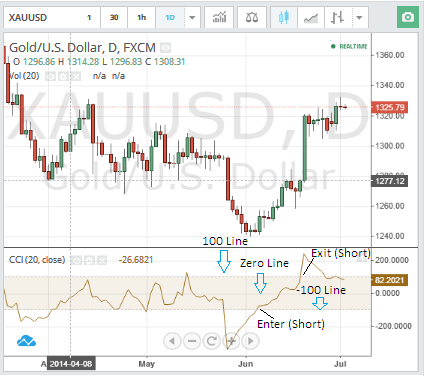 Exit Signal – Long Position: You should exit the trade when CCI turns around and start moving higher after you bought the currency pair. Place stop loss at the nearest level of resistance. Short Position: You should exit the trade when CCI turns around and start moving lower after you sold the currency pair. Place stop loss at the nearest level of support.
Moving Average Convergence Divergence (MACD)
Moving Average Convergence Divergence (MACD) trading indicator was developed by Gerald Appel. It indicates reversal of trends when the bearish trend changes to bullish trend and vice versa. MACD confirms strength of the price trends and indicates momentum of the currency prices. 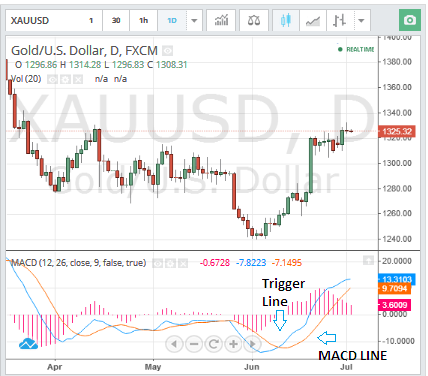 Entry Signal – Long Position: You should make entry when the MACD line crosses above the trigger line. This shows that the trend has reversed from being bearish to bullish. Short Position: You should make entry when the MACD line crosses below the trigger line. This shows that the trend has reversed from being bullish to bearish.
 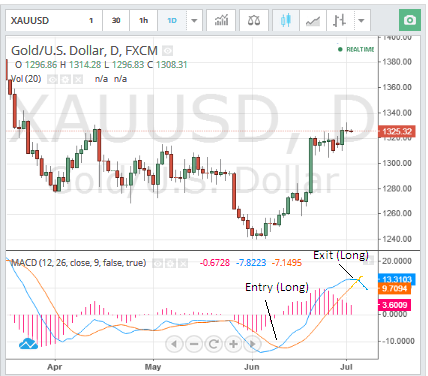 Exit Signal – Long Position: You should exit the trade once the MACD line crosses back below the trigger line showing change in trend. Short Position: You should exit the trade once the MACD line crosses back above the trigger line showing change in trend.