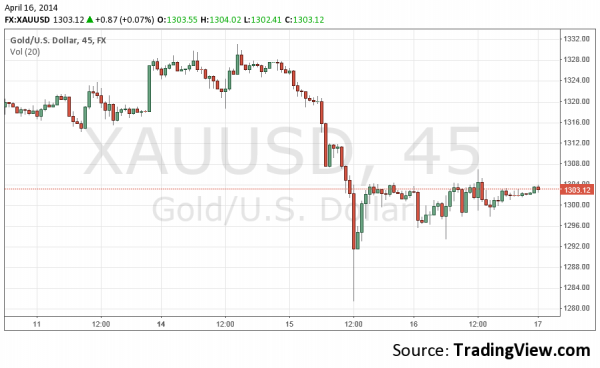
Gold candlestick charts tell you everything you need to know about market momentum and price action. They can give you a trading advantage, but you’re out of luck if you don’t know how to read them – until now. Use this guide to understand how to read gold candlestick charts and refine your trading strategy:
Anatomy of Gold Candlesticks
Candlesticks representing the action on gold can be short or tall and black or white (or some other colour combination). They can also have long or short upper or lower wicks/shadows. These features can be combined in a multitude of ways to represent the market momentum for gold.
Body Length
Body length represents the buying or selling pressure of gold. The longer the body, the more intense the buying or selling pressure. A short body, in contrast, means there is very little buying or selling activity.
Colour
The colour of the body represents whether the pressure is coming from buyers (bulls) or sellers (bears). The colour will depend on the taste of the chartmarker. On one chart, white may represent buying pressure and black selling pressure. On another chart, buying pressure may be red while selling pressure is blue. In this article, we will use white and black for simplicity.
Long white candlesticks have closes that are well above the open. This means that buyers were aggressive throughout the day, and far outmatched sellers. Long back candlesticks, on the other hand, have closes that are below the open. Sellers were more aggressive than buyers.
Wicks/Shadows
Aside from the body, the “wick” or shadow of the candlestick also conveys important information. The upper and lower shadows indicate the session highs and lows. If shadows are short in either or both directions, it indicates that the trading action stayed around the opening and closing prices for the most part. Longer wicks/shadows indicate that trading action varied quite a lot from the opening and closing prices.
Shadows tell you a lot about the action during the day. If a candlestick has a long upper shadow and short lower shadow, it means that buyers drove prices up, but sellers eventually brought prices back down toward the opening price. If a candlestick has a short upper shadow and a longer lower shadow, it means that sellers pushed prices down a bit during the day, but buyers came and drove prices back up to its opening price.
Now you understand how to read candlestick charts. Put this information to use and kickstart your gold trading today.


